6.9 KiB
Drawing with numbers: Drawing primitives & image manipulation
Sketch: 3.0 Drawing text
So far, we have mainly dealt with text printed on the console. Pretty 1980 is you ask me. It is an aesthetic (of course) though we can also display text on the canvas as well!
Consider the following sketch using the text function.
// Drawing text!
const sentence = "YOU ARE MY AMOROUS ENCHANTMENT.: MY KEEN EAGERNESS. YOU ARE MY DEVOTED ENCHANTMENT. MY YEARNING FERVENTLY LIKES YOUR AMOROUS PASSION. MY EAGERNESS TENDERLY YEARNS FOR YOUR PASSION."

function setup() {
  createCanvas(800, 800);
}

function draw() {
  background("yellow");
  text(sentence);
}
What do you observe when you run the sketch?
📚 Exercises
To complete the following exercices, have a loot at the section Typography in the p5js reference.
-
Modify the sketch 3.0 and enlarge the text's font size.
-
Create a "text box" in which the text can be displayed in full (i.e. wrapped in the box).
-
Can you change the font of the text?
-
How about the font colour?
-
And the text's alignment (left, center, right)?
-
Homework: Using p5js' typography functionality, write Love Letters on the canvas resembling the original letter from the MUC.
Sketch: 3.1 Simple colour animation
Let's play with colours with the following sketch.
// Colour animation!
const sentence = "I DON'T LIKE PIZZA\n(I just don't)";

function setup() {
  createCanvas(800, 800);
}

function draw() {
  background("yellow");
  textSize(45);
  textAlign(CENTER, TOP);
  noStroke();
  fill(0, 0, 255);
  text(sentence, 800/2, 800/2);
}
Remember sinusoidal waveforms in your Mathematics class in school? Well they are fabulous!
Sinus and Cosinus are great trigonometric functions to play with as they can help produce simple animations. Sinusoidals (sinus or cosinus) have interesting properties that can easily be parametrised.
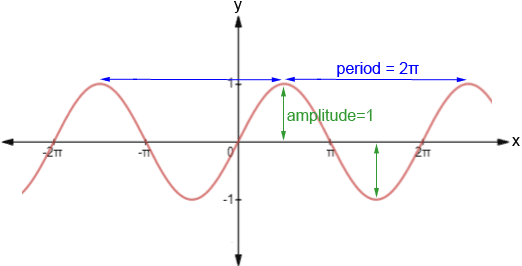
In our p5js environment there is a sin function that can be used along a special frameCount counter that literally keeps track of the number of frames that have been drawn on the canvas. By inputting frameCount to the sin function it will return a real number between -1 and 1 (see figure above). In fact this real number will “oscillate” between -1 and 1, following the sinusoidal waveform.
A statement like to one below will roughly oscillate between 0 and 255 each time frameCount is incremented.
let osc = 128 + sin(frameCount) * 127;
📚 Exercises
-
Can you explain why there is a 128 and a 127 in the statement above?
-
Modify sketch 3.1 and change the colour of the text with the
oscvariable above. -
What do you observe? How can the speed of colour change be slower? In other words, is there a way to slow down the
frameCountinput of thesinfunction?
Sketch: 3.2 Keeping track of clicks with arrays and animate shapes
In sketch 1.1 we drew circles on the canvas when we pressed the mouse. One problem we had was with the background remember? The background function was erasing our circles.
Now that we understand arrays we can fix this problem by "recording" the location where the mouse was pressed. To do so we will produce a "record" of each mousse press y adding the location of the mousse when pressed to an array. This "record" will be a p5js vector having a X and Y coordinate.
// Capture mouse pressed and record locations!

var circles = [];					// this is the array in which we will add p5js vectors

function setup() {
  createCanvas(800, 800);
}

function draw() {
  background("yellow");

  if(mouseIsPressed) {
    let v = createVector(mouseX, mouseY);		// create a vector with the current mouseX and mouseY coordinates
    circles.push(v);							// add the vector to our array with the "push" function
  }

  // now for each vector in our array, draw a circle at its location
  for(let i = 0; i < circles.length; i++) {
    let c = circles[i];
    circle(c.x, c.y, 10);
  }
}
The drawing produced by the sketch looks very much like sketch 1.1 right?
True. But with this code we can draw more interesting things than we could in sketch 1.1. Since we have a global array (circles) we can access each circle and animate them in different ways, something that was practically impossible in sketch 1.1.
📚 Exercises
-
Modify sketch 3.2 and make the circle oscillate (i.e. changing each circle's X and Y position) using the
sinfunction and p5js'frameCount -
Add randomness to your circles' oscillation so that each individual circle moves slightly differently than its neighbours.
Sketch: 3.3 Image
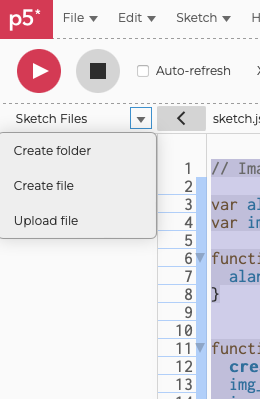
With p5js we can also work with images. The way this works is to upload them to our online environment by opening the "Sketch files" and the left side of the page and select upload files.
When the image is uploaded, we can display it on the canvas as follow (for this sketch I am using this image):
// Image!

var alan_img;       // global image variable
var img_x, img_y;   // coordinates of the image on the canvas

// special function that loads the image to our global variable
function preload() {
  alan_img = loadImage("alan-turing.png")
}


function setup() {
  createCanvas(800, 800);
  // to draw the image at the center of the canvas
  // we need to offset the image coordinates with
  // the half of image's width and height
  img_x = 400 - alan_img.width/2;
  img_y = 400 - alan_img.height/2;
}

function draw() {
  background("yellow");
  // draw the image as the specified coordinate
  image(alan_img, img_x, img_y);
}
Now this is rather simple. You can of course play with the coordinates of the image as we did with our circles above but have a look the Image section in the p5js reference and consider the simple manipulations you can use on your image.
📚 Exercises
-
Modify sketch 3.3 so that the "alpha" channel of the image changes when the mouse is moved to the right (X coordinate). The
tintfunction will help you do that. -
Now do the same for the B channel (RGB) when the mouse is moved up and down (Y coordinate). Again, the
tintfunction will help you do that. -
There is a way to save your canvas as an image with p5js'
saveCanvasfunction. Add this functionality to your sketch and save it when the keysis typed.